
- Training
- Service
- Promotion
- Schedule
- Testing Center
- News
- Contact
11/11/2021


Introduction
If you're a member of one of our training programs you've probably heard me say that, “Excel is a tool with infinite possibilities and opportunities”. It is packed with features that allow us to do everything from analyzing data to creating interactive applications.
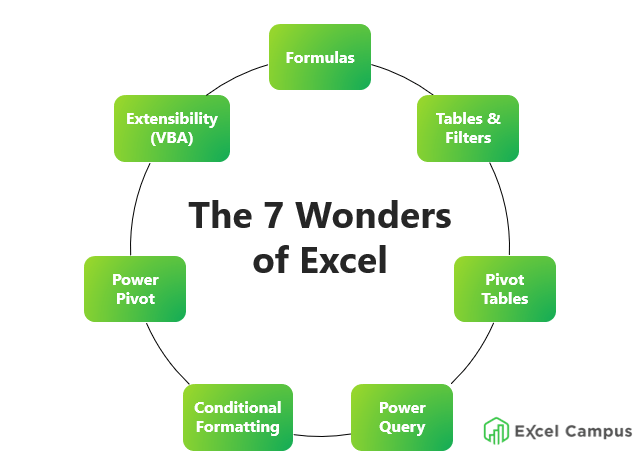
My goal for this post is to share the seven most important features of Excel that will help you get your job done faster and impress your boss/users.
“Excel is a tool with infinite possibilities and opportunities”
This, of course, is a highly subjective list. It's difficult to pick just seven features. But I believe these are the features that will make the most impact in your Excel projects and also get others asking, “Hey, how did you do that??“
#1 Formulas
Formulas and functions are the heart of almost every Excel file and financial model. Excel's calculation engine is incredibly powerful, allowing us to perform complex calculations on thousands of data points in a fraction of a second.
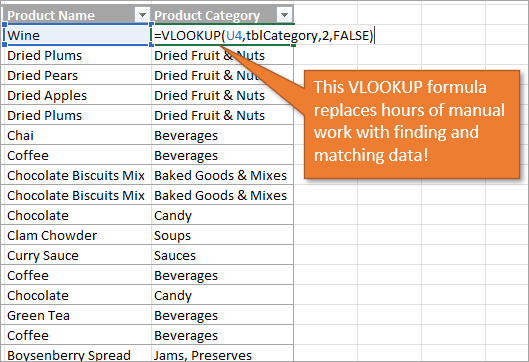
I remember the first time I copied a VLOOKUP formula down thousands of cells and saw all of the results appear instantly. I was in awe of how quickly the task was done. This would have taken me hours to find the matching results by manually scanning the sheet or using the Find window.
Microsoft has made some amazing improvements to formulas in recent years with features like Dynamic Array Formulas (spill ranges) and Rich Data Types that allow us to store multiple data points in a single cell.
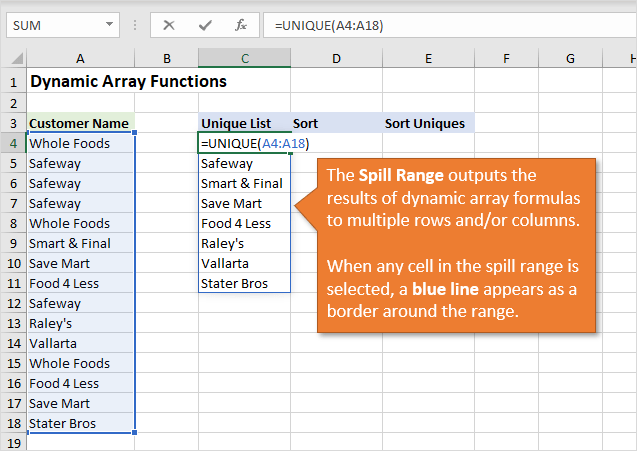
I believe formulas have a special place in every Excel user's heart. With all these new features, we will never run out of things to learn with formulas. It is a skill that we continually practice, learn, and improve upon for life.
#2 Tables & Filters
Excel Tables have become a vital part of most modern financial models or report files. I like to refer to them as “a worksheet within a worksheet” because they keep our data contained and organized. This allows us to create formulas, pivot tables, and reports that automatically include new data, which helps save time and eliminate errors.
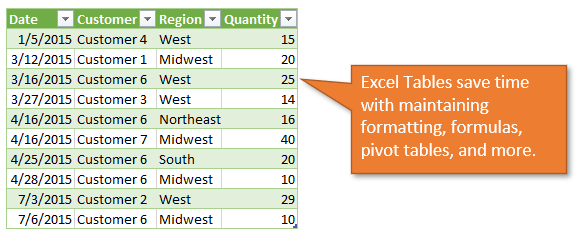
Tables have a ton of features and advantages.
A few of my favorites are:
All of these features save us time when working with data and tying out numbers in our reports and analysis.
#3 Pivot Tables
Pivot tables are BOTH the simplest and most complex feature of Excel.
Well, I believe the name “pivot table” makes them sound more advanced or complex. There is a lot of mystery behind that term that scares many Excel users away. And I think it's a real shame.
Once you understand what a pivot table is and how easy it can be to use, you unlock a whole new world of Excel and data analysis.
Pivot tables are summary reports.
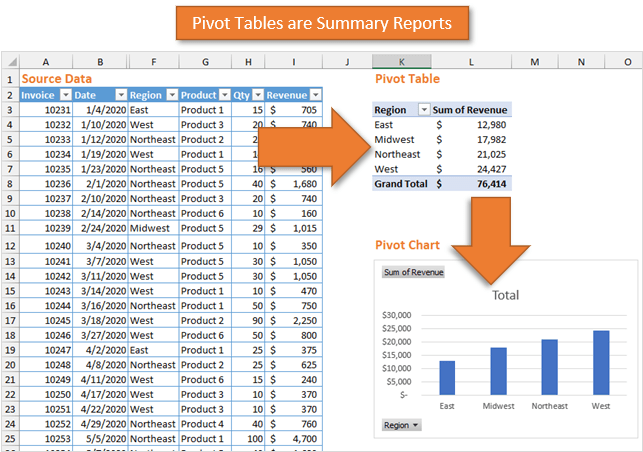
However, they are also much more than that because pivot tables allow you to create summary reports WITHOUT writing any formulas. With simple drag-and-drop and a few button clicks, you can turn a big set of data into a summary report and interactive dashboard with charts and slicers (filters).
Pivot tables are also the gateway to business intelligence tools like Power Pivot, Power BI, Tableau, etc. Understanding how pivot tables work is critical knowledge for those advanced data analytics tools.
#4 Power Query
So, what is Power Query?
Power Query is a data automation tool for preparing and importing data into Excel or Power BI.
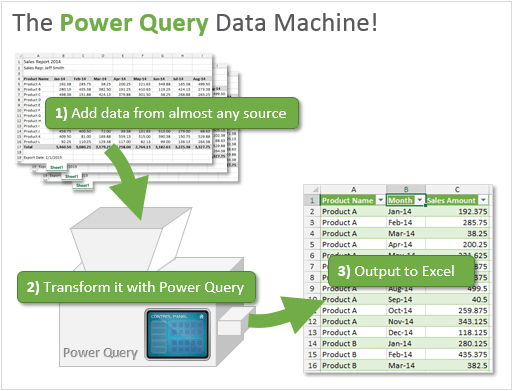
To me, the key word in the sentence above is automation.
A study by Forbes showed that 80% of a data analyst's time is spent cleaning & preparing data. This is the grunt work of removing blank rows/columns, converting text to dates, splitting/combining columns, stacking or appending data sets, etc.
It ends up being the most boring and tedious work, and the place we tend to make the most errors as we get frustrated with the repetitive copy/paste and formatting tasks.
Power Query helps us completely automate this data cleanup work. And just like pivot tables, you can do it all with simple button clicks in the Power Query Editor. You do NOT need to write code.
It essentially allows us to create automations for very specific data cleansing and importing tasks. Once you create the query, you can run it over and over again (refresh) as you get new data.
The data can be in an Excel file, CSV, database, website, and many other sources.
This not only frees them up to spend time on creating charts and dashboards (the fun stuff), but also reduces errors, stress, frustration, and overtime.
#5 Conditional Formatting
This one is probably the most questionable item on the list for me. You might have another favorite feature of Excel that you would put in place of Conditional Formatting.
But I have it here for two main reasons:
Wow Factor
The first reason is Wow Factor.
Conditional Formatting allows us to dynamically change the formatting of cells based on a condition. For example, you can use it for goal/targets and automatically shade a row green when a goal number is met and shade the row red if not.
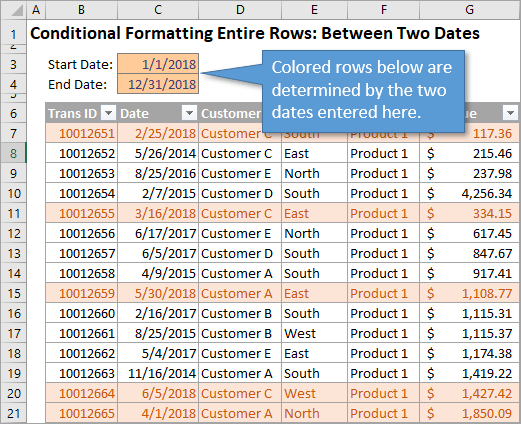
The awesome part is that the formatting will automatically change when the values in the cells change.
The possibilities are endless and it can save you a ton of time when you are preparing your reports. It will also make the users of your files say, “Wow! How did you do that??”
Ease of Use
The second reason is Ease of Use.
And by this I mean, Conditional Formatting can make it easier for your boss or co-workers to use and consume your Excel files.
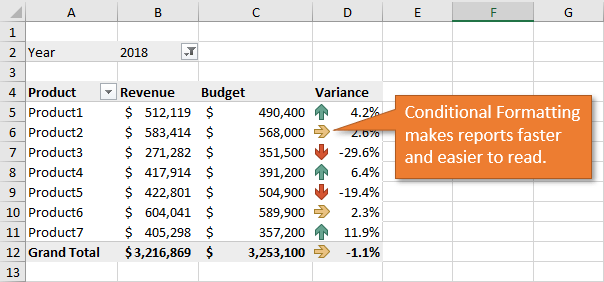
Believe it or not, not everyone likes looking at a giant grid of text and numbers. Excel files can quickly get overwhelming, leaving users confused about what to look at.
Conditional formatting can help solve this by bringing attention to the most important results on a sheet. This will save you and your users time, and reduce overwhelm.
#6 Power Pivot
Power Pivot is another one of the “power” tools that can feel a bit intimidating. In my opinion, it is an advanced tool.
However, it is also extremely useful and can eliminate the need to maintain complex VLOOKUP formulas.

Power Pivot essentially brings the functionality of a relational database into Excel. You will also hear it referred to as the Data Model.
This feature allows us to create relationships between multiple data tables for more advanced reporting. A good example is Actuals versus Budget reporting.
If you have two or more tables that store your revenue and budget/forecast data, you can create pivot table reports that compare this data based on time period, department, or any other common factor.
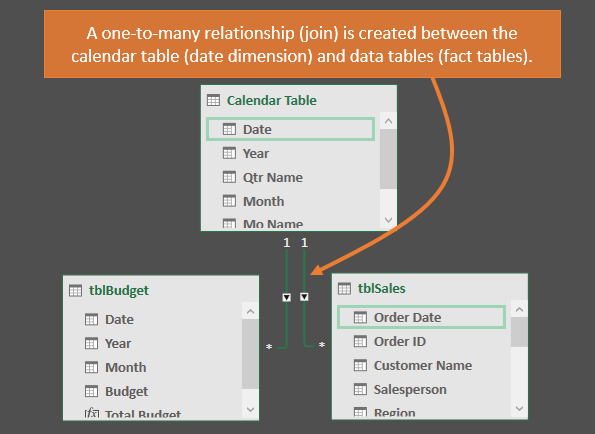
Power Pivot also contains a formula language called DAX that allows you to write complex calculations across the tables in the data model.
I like to think of it as Pivot Tables on steroids.
The possibilities become absolutely endless when you also consider the set of CUBE functions that you can use in Excel to create customized reports.
You don't have to be a mad scientist to use Power Pivot, but if you want to drive the Lamborghini of Excel then this is your playground.
#7 Extensibility
I probably wouldn’t be here, typing this post, if it wasn't for Excel's extensibility. Specifically macros & VBA.
Extensibility is just a fancy word for the ability to program and extend the functionality of Excel.
We now have several options for this including VBA (macros), JavaScript APIs, OfficeScript, and more. Some might even put the new LAMBDA function in this list.
For me, this programmability of Excel is what makes it truly limitless.
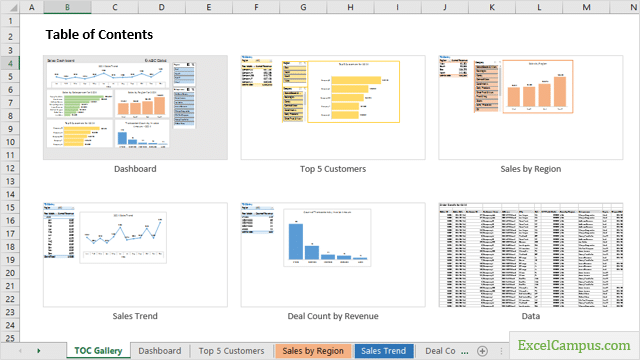
Create this Table of Contents Gallery in seconds with a macro or our Hero Tools Add-in.
I have written thousands of macros and created hundreds of features in our Add-ins to automate processes in Excel. Extensibility allows us to create features in Excel that don’t yet exist in the product.
For example, I originally created my PivotPal add-in so I could have a search box for the fields list. Something that didn't yet exist in Excel.
My Tab Hound add-in's core functionality is the ability to search for sheet tabs in the workbook and quickly navigate to them. I've also created several add-ins that allow you to create custom keyboard shortcuts for formatting and paste special operations.
The point is, if you have an idea to improve Excel based on a specific problem you encounter frequently, you can create a solution for it WITHOUT waiting for Microsoft to develop the feature.
Explore the 7 Wonders
I had the honor of being on a call with Brian Jones recently, the head of the Excel Team at Microsoft, and he was talking about how they see Excel as a platform for building applications.
“Excel is a platform for building applications”
I couldn't agree more and I love that Microsoft continues to see Excel this way. The new features that they continue to release every month show their dedication to this philosophy.
These features give us more freedom to be creative in developing applications (spreadsheets) that save us time, automate processes, eliminate boring work, and provide opportunities for growth.
So I encourage you to invest time in exploring and learning these amazing features of Excel.
Source: www.excelcampus.com

12/11/2025


