
- Training
- Service
- Promotion
- Schedule
- Testing Center
- News
- Contact
5/18/2020


Bottom line: Learn how this awesome feature of Excel and Power BI called Power Query will help you automate the process of importing, transforming, and cleansing your data to save a TON of time with your job.
Skill level: Beginner
In this tutorial I provide an introductory explanation of Power Query. You will learn why this is my new favorite Excel tool for working with data, and how it can help automate processes and save you time!
I was watching a TV show on how things are made, and they were explaining how a depositor machine worked in a pastry factory.
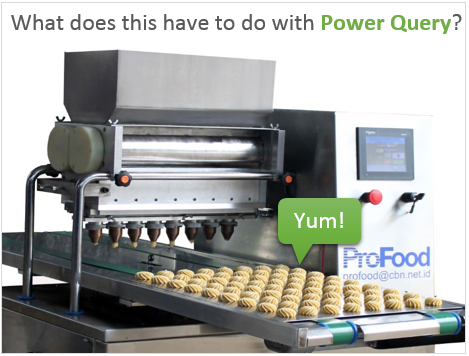
The basics of a depositor machine are:
Once the dials are set, the process can be repeated over-and-over again to make perfect pastries every time. Getting hungry…? 🙂
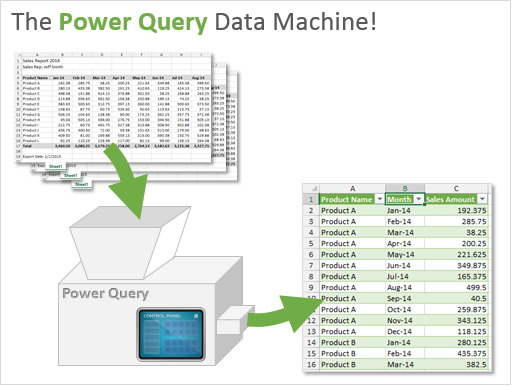
Power Query works in a very similar way!
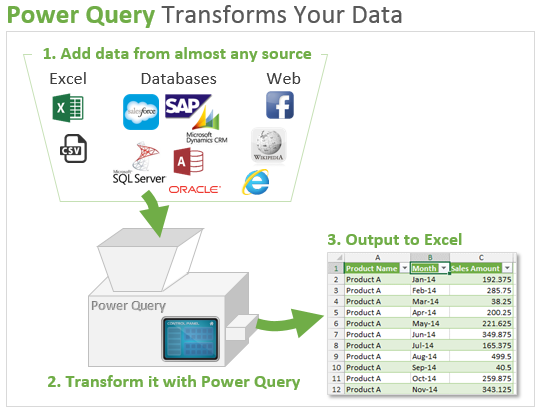
Power Query is like a machine because once you have your query setup, the process can be repeated with the click of a button (refresh) every time your data changes.
If you have used macros to transform your data, you can think of this as a much easier alternative to VBA that does NOT require coding.
Do you work with data that has been exported from a system of record? This could be a general ledger, accounting, ERP, CRM, Salesforce.com, or any reporting system that contains data.
If so, you probably spend a lot of time transforming or re-shaping your data to create additional reports, pivot tables, or charts.
These data transformations could include tasks like:
Do any of these tasks sound familiar? If so, then they probably also sound boring, repetitive, and time consuming. 🙂 Believe me, I’ve spent the better part of my career doing these tasks and trying to figure out faster ways to get them done.
Fortunately, Power Query has buttons that automate all these tasks!
Starting in Excel 2016 for Windows, Power Query has been fully integrated into Excel. It is now on the Data tab of the Ribbon in the Get & Transform group.
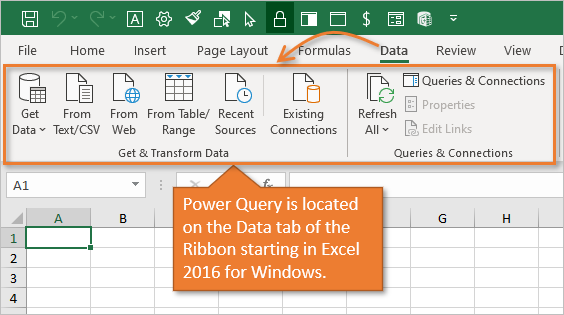
In Excel 2010 and 2013 for Windows, Power Query is a free add-in. Once installed, the Power Query tab will be visible in the Excel Ribbon.

You use the buttons in the Data or Power Query tab to get your source data. Again, your data could be stored in Excel files, csv files, Access, SQL server database, SharePoint, Salesforce.com, Dynamics CRM, Facebook, Wikipedia, websites, and more.
Once you have specified where your data is coming from, you then use the Power Query Editor window to make transformations to the data.
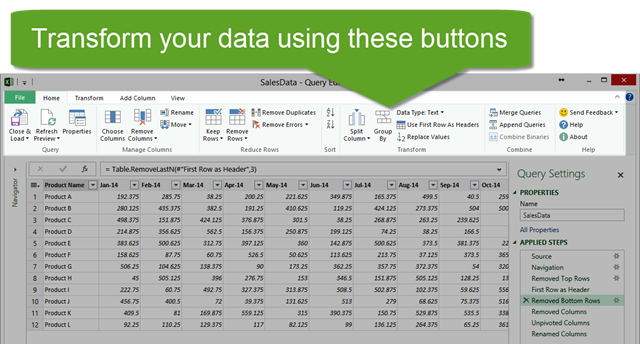
The buttons in the Power Query Editor Window allow you to transform your data.
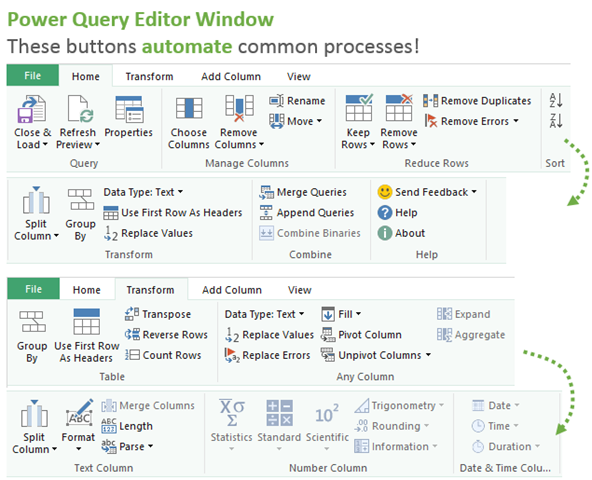
Think about some of those tasks you do repeatedly as you browse the buttons in the image above. Each time you press a button your actions (steps) are recorded, and you can quickly re-apply the steps when you receive new data by refreshing the query.
After completing your steps, you can output the data to a Table in your Excel workbook by clicking the Close & Load button.
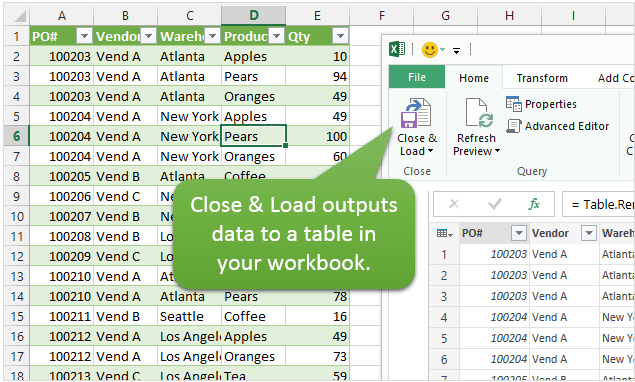
You can also modify existing queries and refresh your output tables with the changes or updated data.
Here are a few examples of what Power Query can do with your data.
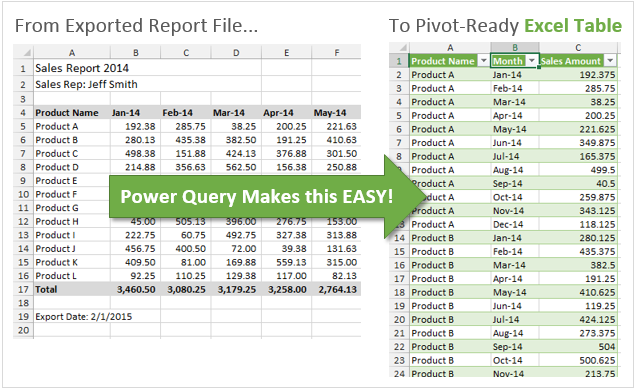
My favorite feature of Power Query is it’s ability to Unpivot data. This is a technique used to get your data ready for the source of a pivot table. This is also referred to as normalizing your data to get it in a tabular format.
The data might start out looking something like the following.
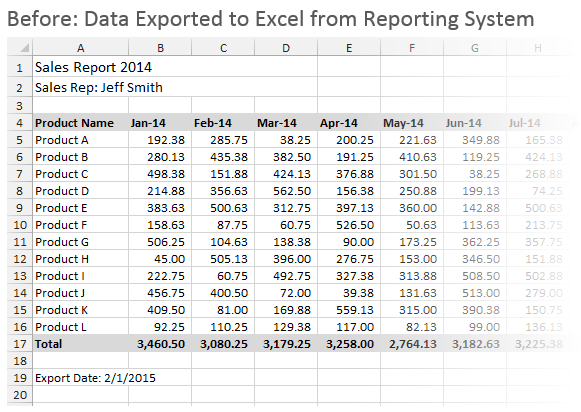
And you want the end result to look like this.
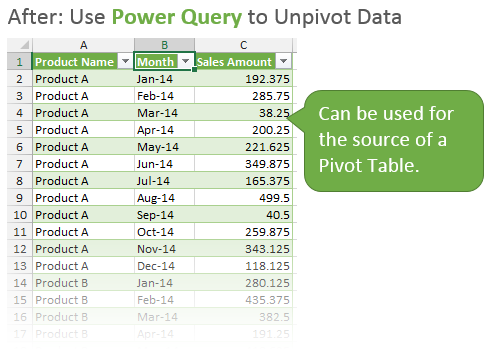
Power Query can do this with the click of a few buttons, and prepare your data for use in a pivot table.
The Append feature of Power Query allows you to combine multiple tables (stack them vertically) to create one large table. It can do this with multiple tables in one file, or it can pull in data from a bunch of different files/sources.
Let’s say you have a folder that contains CSV or Excel files with report data for each month. Throw all those files in the Power Query machine, and it will spit out one nice table that you can then use to create pivot tables and charts.
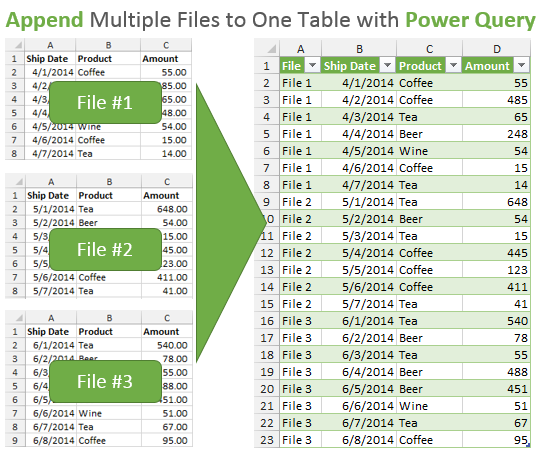
If the data in those reports also needs to be transformed (remove rows, split columns, unpivot, etc.), then Power Query can handle that in the same process.
Once it is setup, all you have to do is hit the refresh button every month when a new file is added to the folder and the rows will be added to your output table.
Power Query has the ability to merge or join tables. This can be used as an alternative to VLOOKUP or INDEX/MATCH formulas.
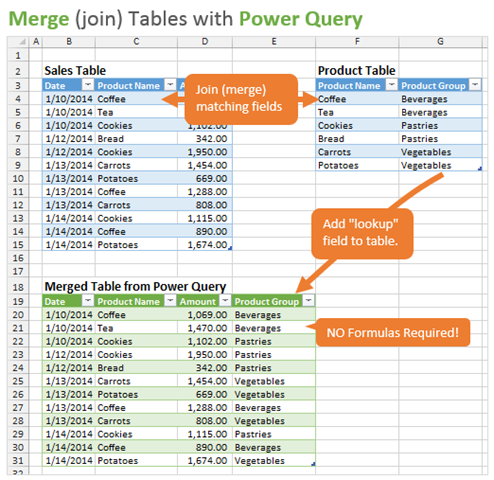
Let’s say you have this data table of sales records, and you are using a VLOOKUP to bring in information about the product based on the name of the product sold. Your product group information is located in another table on a different sheet or workbook.
Using VLOOKUP formulas is great, but it can often mean adding thousands of formulas to your workbook. Which increases the file size and calculation time.
Power Query makes it very fast and easy to merge two tables together with just a few clicks. It basically uses SQL joins, so you can even do more advanced merges like inner, outer, left, right, full, and anti joins.
Power Query was designed so that you do NOT have to know how to code to use it. It is very easy to use because you can just click buttons and apply filters like you normally would in Excel.
However, Power Query can be programmed to create custom functions. This gives you seemingly unlimited potential to transform your data in just about any way possible.
It is based on the M language, and most of the functions are very similar to writing a formula in Excel. This also makes it more user friendly and easier to learn the code.
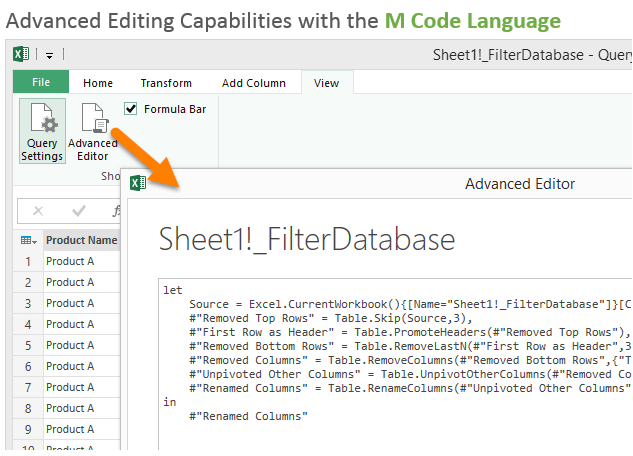
This new language and set of functions means there is a lot to learn, but I consider that the fun and challenging part. Plus, employers of the future will definitely be looking for employees with Power Query skills.
Power Query not only makes all these tasks easier, but it also records your steps so you do NOT have to do them over-and-over again. It will save you a lot of time if you are preparing the same data every day, week, or month.
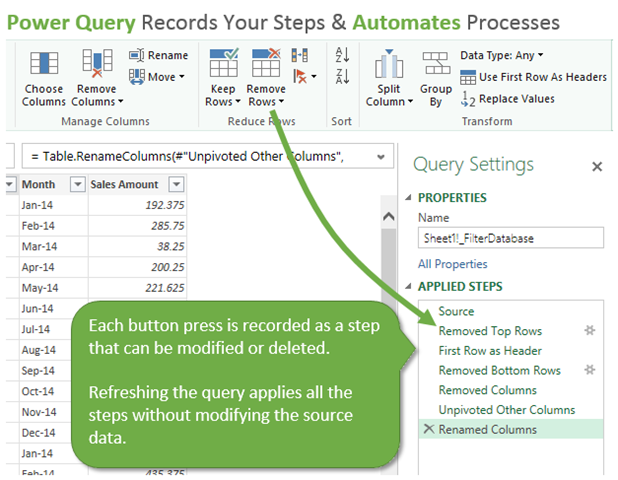
It also does a pretty good job of handling errors. If the structure of your source data changes, Power Query will tell you what step it broke at and allow you to fix it. This makes maintenance easy and you don’t have to completely redo your process when something changes.
You can use Power Query to get your data ready for use in pivot tables, charts, and dashboard reports. This is a critical step in the process of summarizing and analyzing data.
Well, it can’t exactly make cookies, but Power Query is a pretty awesome tool! It will save you a ton of time when transforming your data.
Power Query is just one piece of the suite of Power BI (Business Intelligence) products from Microsoft.
If we go back to the analogy of baking cookies in a factory, you can think of Power Query as the first step in the assembly line. Once the cookies are formed, we then need to bake them (Pivot Tables, PowerPivot) and then package them for presentation (Power View, Power Map, Charts, Dashboards, etc.)
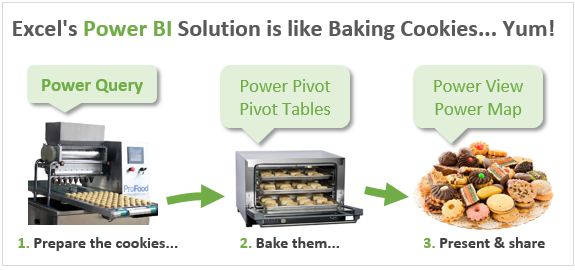
You can think of Excel as the factory building that houses all these tools. The exciting part is that there is a very bright future for Excel! All these advances in technology will help us make sense of our data in new ways, save us time, and impress our bosses. 🙂
Source: https://www.excelcampus.com/power-tools/power-query-overview/

12/11/2025


