
- Training
- Service
- Promotion
- Schedule
- Testing Center
- News
- Contact
10/7/2022


Learn the differences and similarities between Power BI and Excel, and when you should use each.
Microsoft Excel has been around since 1985 and has become commonplace in the business and academic environment. Power BI, on the other hand, is less than 10 years old, and while it is much less well known, it offers far more powerful features and is a better option in many scenarios.
In this article, we'll go over the key similarities and differences between Power BI and Excel as well as give some guidance on how to choose between these tools for your use case.
Excel is a spreadsheet software created by Microsoft and is a component of the Office product suite and the Office 365 package. First released in 1985, Excel has become commonplace in business and academia. For example, it's used in human resource management, operations management, and performance analysis and reporting.
Excel is an all-purpose spreadsheet tool that is used to organize and analyze data, both small and large, with formulas, functions, and even macros (for technically inclined individuals).
The key features of Excel that make it an excellent tool for a wide range of data analysis tasks incldue:
Power BI is a Business Intelligence (BI) tool. The main purpose of BI tools is to track Key Performance Indicators (KPIs) and uncover insights in business data to inform decision-making across the organization better.
Power BI is used in many different ways depending on the role of the individual, from developers, analysts, managers, and directors, to everyone in between.
Power BI comprises three main applications:
Some of the key features of Power BI that have contributed to making it one of the top BI applications, according to Gartner, are:
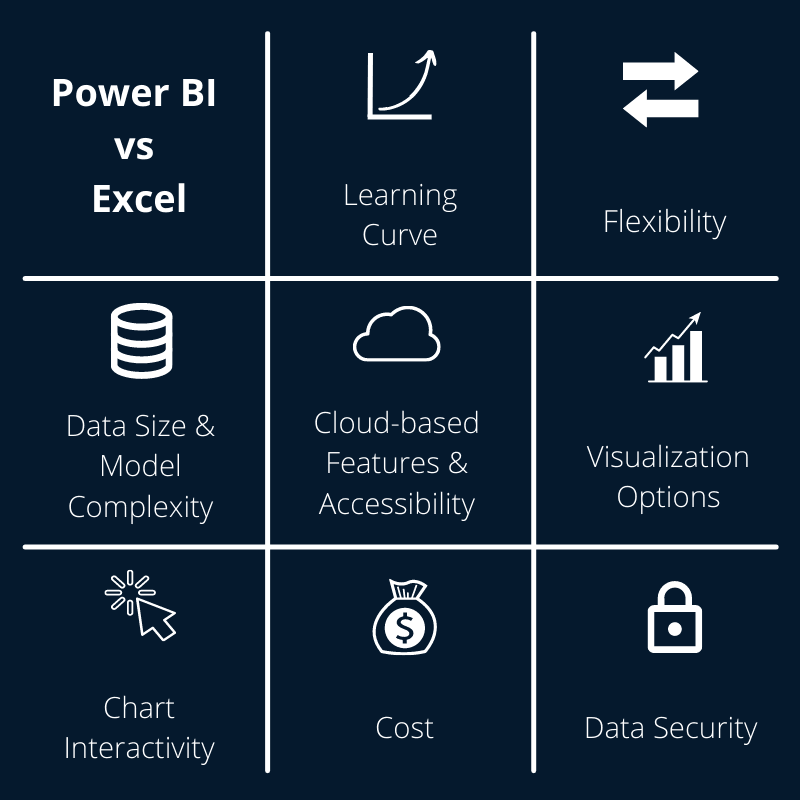
Excel is a commonplace tool (released in 1985) that is widely available, with many users already using it day-to-day. This means that it is highly likely that many users will have heard of and even be very familiar with the application. In addition, there is a wide range of resources and training available for learning how to use Excel in almost any use case.
However, Power BI is a relatively newer (released in 2014) and separate application. While it is gaining popularity quickly, there are still fewer resources available than with Excel. Power BI is also regarded as a more complicated application with more technical expertise required to build and implement solutions to business problems. However, Microsoft has done an excellent job providing helpful resources that are beginner-friendly, and the application is much more intuitive to use than one may at first think.
Flexibility can be thought of in terms of a spectrum from highly flexible to fully automated. There cannot be a situation where something is fully automated and perfectly flexible.
The purpose of automation is to ‘set it and forget it,’ and this is where Power BI shines. On the other hand, Excel is a highly flexible tool capable of delivering uniquely customized solutions.
Excel has a limit on the amount of data that can be stored and presented at once - just over 1 million rows and 16 thousand columns. Beyond this point, the Excel workbook would either fail to open or only part of the data will load.
On the other hand, Power BI does not have this restriction and can handle millions of rows of data. When publishing reports to Power BI Service, you are only restricted to datasets that are less than 1 GB (which is large enough for the vast majority of businesses). Beyond that, Power BI offers Power BI Premium capacity at an additional cost. Because of this, it is good to follow general model-building best practices and only import the data that you really need.
Excel does not offer a cloud-based publishing service, and the only way to share an Excel workbook with someone is to send the file to them directly.
On the other hand, Power BI offers the Power BI Service to easily share reports and dashboards to anyone inside and outside your organization with a Power BI PRO license.
Excel and Power BI do have a core set of visualization options in common such as bar charts, line charts, and pie charts. However, Power BI also offers a much larger selection of visuals as well as custom visuals available in a marketplace called AppSource. Not only that, but Power BI charts are highly customizable and can also be made highly dynamic.
The only way to interact with a chart in Excel is through slicers that effectively filter the data. However, in Power BI, you can interact with charts, tables, and visuals in a much more fluid, intuitive way. You can also include more complex interactions such as drill-through, page-level and report-level filters, and bookmarks.
While Power BI Desktop is free to download and use for personal use on your local PC, it costs $13.70 per user per month for a Power BI PRO license to publish your reports to Power BI Service and share them with others.
Excel is included with the Office 365 package, which is fairly commonplace in business today, so there may be no additional cost to use the application for many people. However, without an Office 365 subscription, you can purchase Excel at a one-time fee of $159.99 for a single user.
The Power BI Service is a highly secure environment for sharing Power BI reports and dashboards. It does not directly expose the underlying data to all users, even if they have a and can view it. Admins get to decide what level of access each user gets.
Excel, on the other hand, does not have these security features. While you can apply password protection to workbooks, sheets, and cells, the underlying data can still be exposed.
Excel and Power BI share a few features in common. Since they were both developed by Microsoft and are both analytical solutions, they have many similar design elements. For example, the ribbon. Both applications have a ribbon across the top containing the core functionality of that application.
Similarly, both applications contain the customization and formatting options for charts along the right-hand side.
Beyond the design similarities, both Excel and Power BI use Power Query for cleaning and transforming data. The addition of this particular feature makes Excel a serious contender for data analysis and reporting.
As discussed above, Excel and Power BI also share many visualization options and data sources. Excel allows you to plot most of the core charts, such as bar charts, line charts, and pie charts as well as connect to the more common data sources such as SQL Server or a standard ODBC. However, Power BI takes this much further with a more extensive selection of both.
In addition, you also have the ability to create and share templates in both Excel and Power BI. In Excel, the fastest way to get started with a template is to pick one from the templates screen when creating a new workbook. However, Power BI has 2 ways you can create and use templates: template apps and creating your own templates.
First, template apps are pre-built Power BI reports created by third-party applications. You can find them by selecting ‘Get Data’ and at the bottom of this screen you will find a button for accessing template apps.
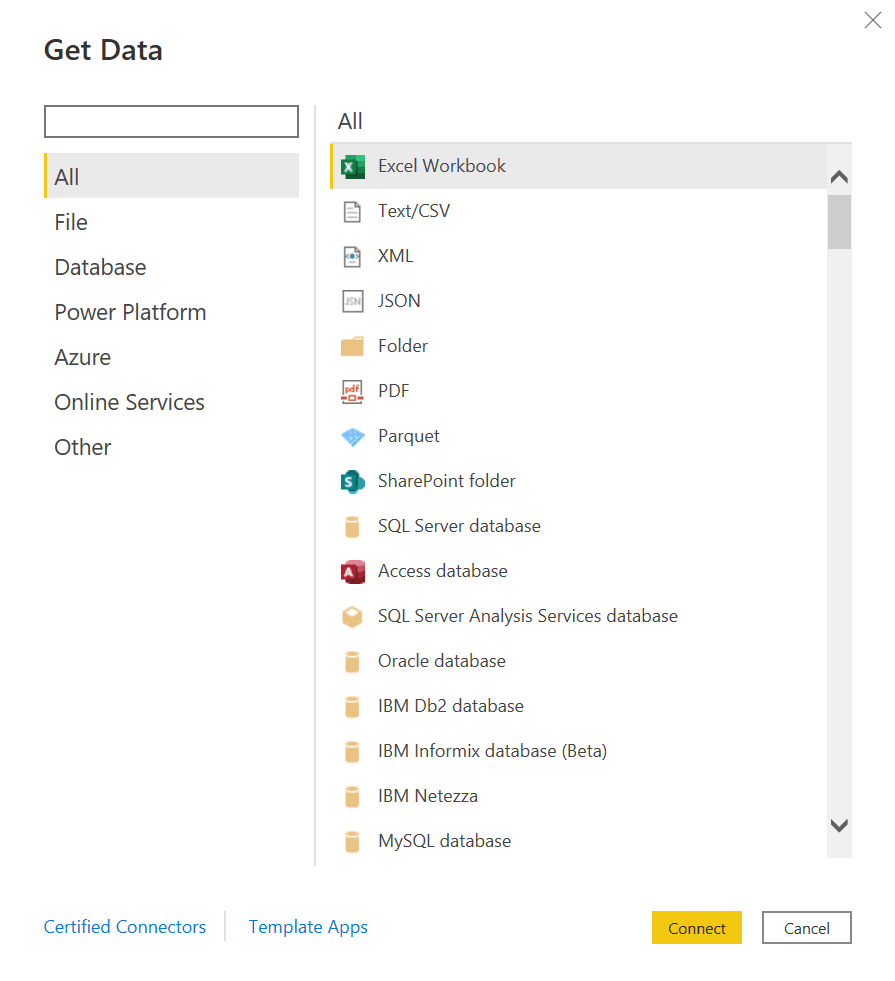
Second, you can create a template from a Power BI report that you built. This template will save the layout, visuals, and Power Query steps so that you can quickly re-use Power BI reports for faster analysis and reporting. These templates are also much smaller than the original reports because templates do not save the underlying data.
You can quickly create a template from an existing Power BI report by selecting File, Export and choose Power BI template. Give it a description and a name and that’s it!
When considering whether to use Power BI or Excel for a particular problem, you can consider three main aspects:
Source: datacamp.com

12/11/2025


