
- Training
- Service
- Promotion
- Schedule
- Testing Center
- News
- Contact
1/17/2024


Before your business can start using Copilot capabilities in Power BI, you need to enable Copilot in Microsoft Fabric.
Note
Copilot for Microsoft Fabric Public Preview is available in Power BI. It helps you use the transformational power of generative AI to help in you get the most from your data. This article provides an overview of the capabilities that were introduced for Power BI.
Power BI has introduced generative AI that allows you to create reports automatically by selecting the topic for a report or by prompting Copilot on a particular topic, and create a narrative visual that generates a summary of your report using generative AI. The following sections cover the details of the features and how to use Copilot.
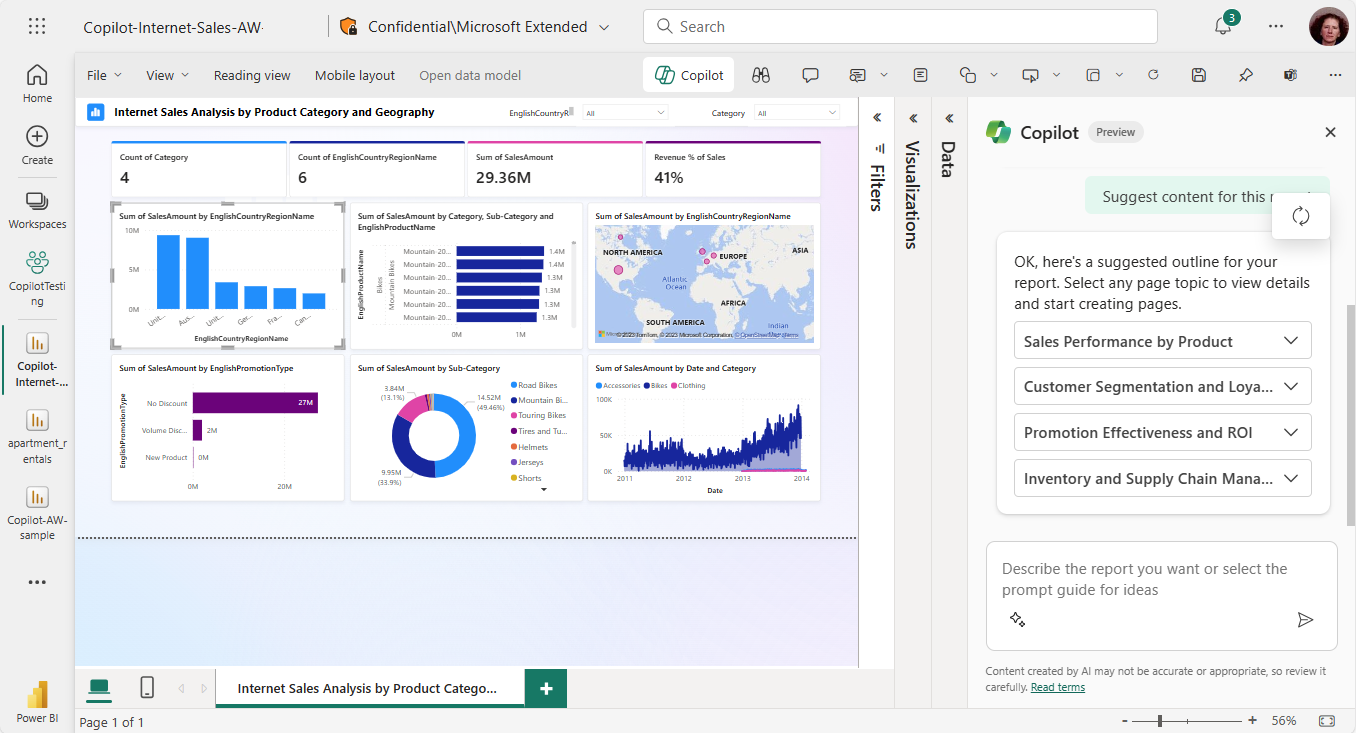
You can interact with Copilot in several different ways in Power BI. The main and most obvious way is to open the Copilot pane and ask Copilot to create a report page, or a summary of a page.
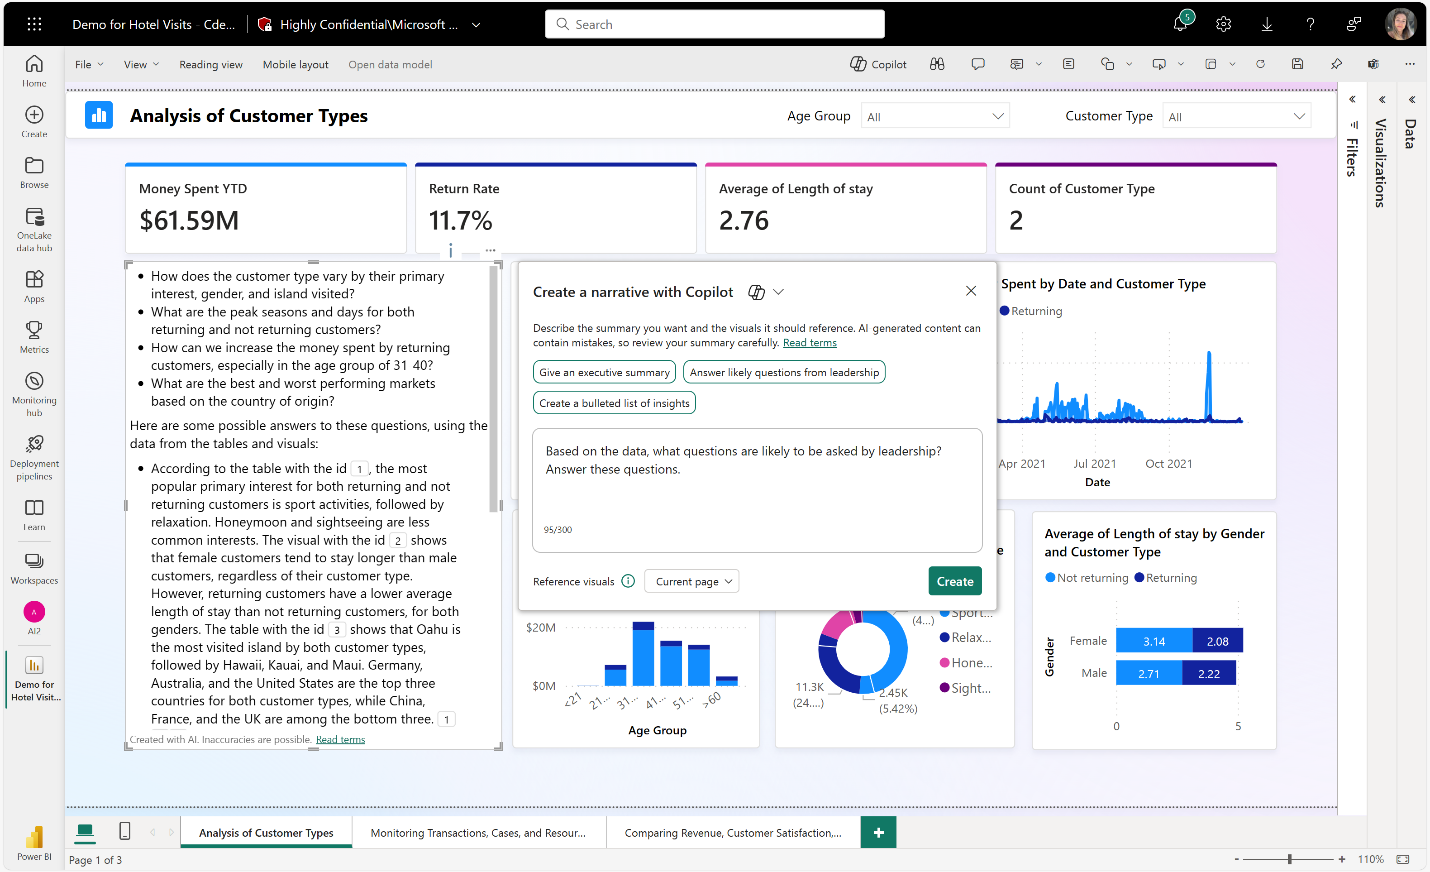
Copilot can also create a narrative visual that summarizes a page or a whole report.
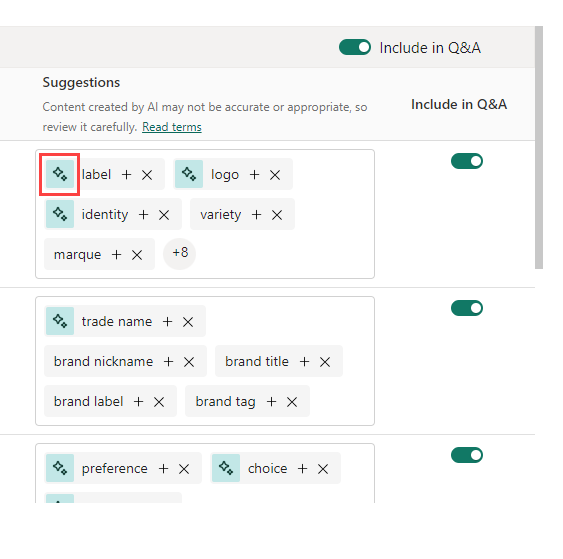
And Copilot can generate synonyms for Q&A, to help your report readers find what they're looking for in your reports.
What follows are examples of what Copilot can generate.
Copilot can provide a summary of your dataset and an outline of suggested pages for your report. Copilot creates a starting point. It might not be perfect, and it might not be exactly what you had in mind. But once you have the starting point, you can modify it from there to be exactly what you want.
With Copilot, you can create a visual that generates a text summary of the data visualized in your report canvas. The visual offers suggested prompts, and a space that allows you to direct the summary for your specific needs, offering an easy to read, useful guide for the end user. The summary updates in keeping with slicers and filters, and as the data refreshes.
Synonyms that you can add to Q&A to improve the Q&A visual's ability to understand user questions
Copilot requirements
To use the narrative visual in Copilot reports and create Copilot reports:
Source: learn.microsoft.com

12/11/2025


