
- Training
- Service
- Promotion
- Schedule
- Testing Center
- News
- Contact
1/24/2024


APPLIES TO: Power BI Desktop and Power BI service
Before your business can start using Copilot capabilities in Power BI, your administrator needs to enable Copilot in Microsoft Fabric.
Note
In Power BI Desktop and the Power BI service, you can use Copilot for Power BI to quickly create a narrative about a report page with just a few clicks. This narrative can summarize the entire report, specific pages, or even specific visuals that you select. You can curate the tone and specificity of the narrative with suggested and custom prompts.
You may need to do some clean-up work on your report. The narrative visual pulls information from what is on the report canvas, not the underlying semantic model, so clearly named visuals and axes are important for the visual to glean highlights, lowlights, and insights from the report.
To see the Copilot button in your report, you first need to select a semantic model.
In the Power BI service, you need to be in an appropriate workspace to see the Narratives with Copilot visual button in the Visualizations pane. The Copilot visual button is the same as the old narratives visual button.
1. The Narrative visual needs content to summarize, so in the Power BI service, select the OneLake data hub, select More options next to a semantic model.
2. Select Create report.
If you're not signed in to Power BI Desktop, you still see the Copilot entry points. When you select Copilot, you're asked to sign in. If your tenant admin has disabled it, you see that it's disabled. If your tenant admin has enabled it and you have access to an appropriate workspace capacity, you can use Copilot.
1. In Power BI Desktop, select Get data, then select a data source.
2. Create a page with visualizations of the data that you want the Copilot narrative to summarize.
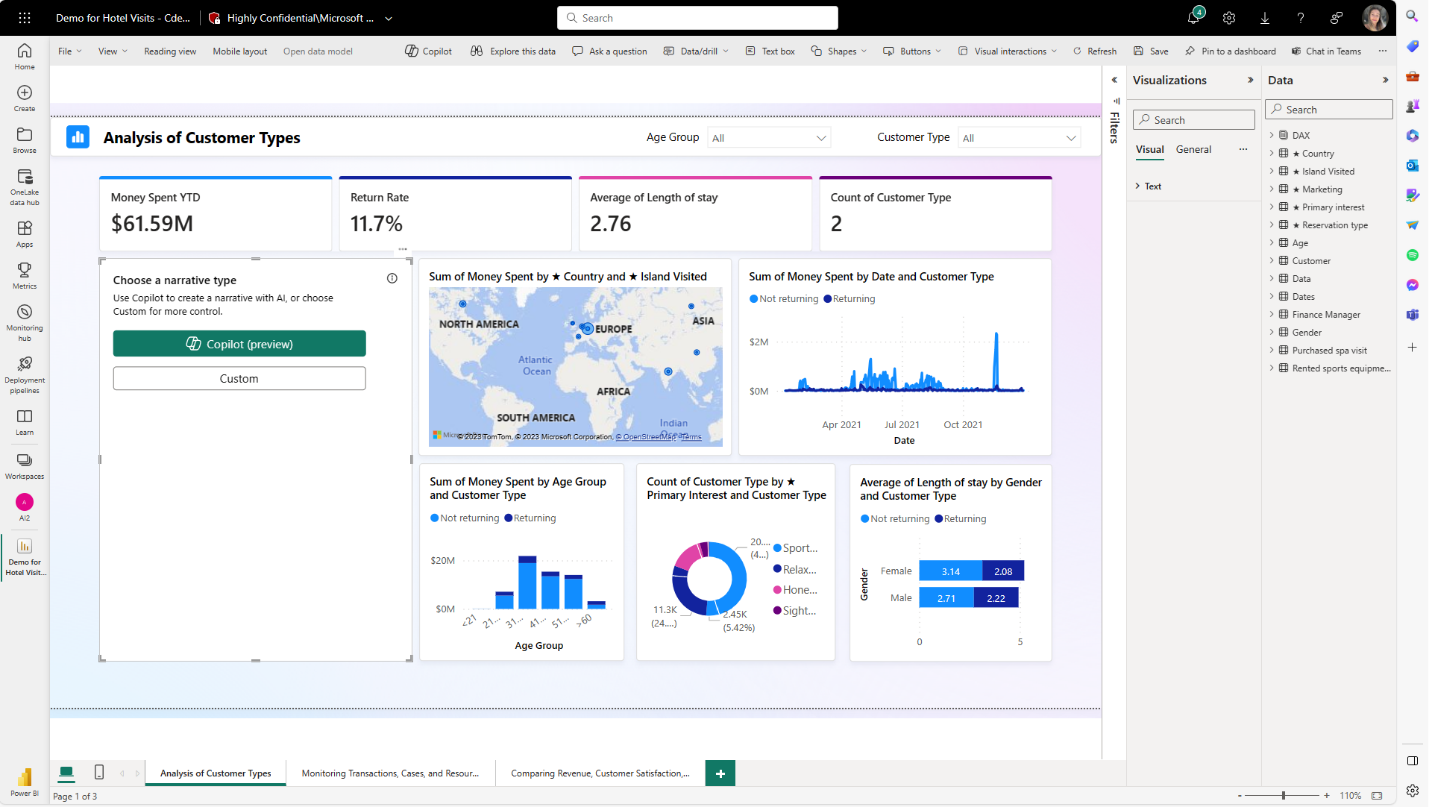
3. In the Visualizations pane, select the Narrative icon.
4. In Choose a narrative type, select the Copilot button to use the new narrative visual.
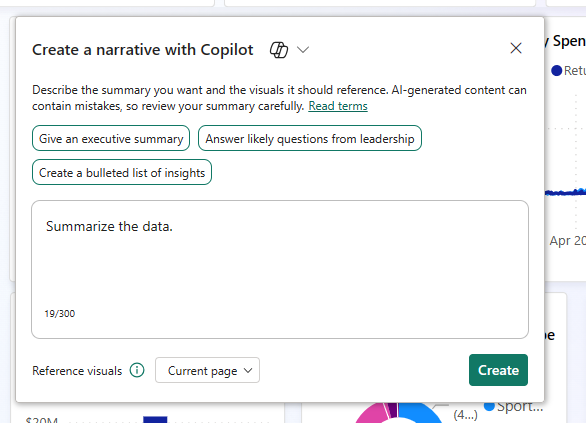
5. Select an option in the Create a narrative with Copilot dialog, and select Create.
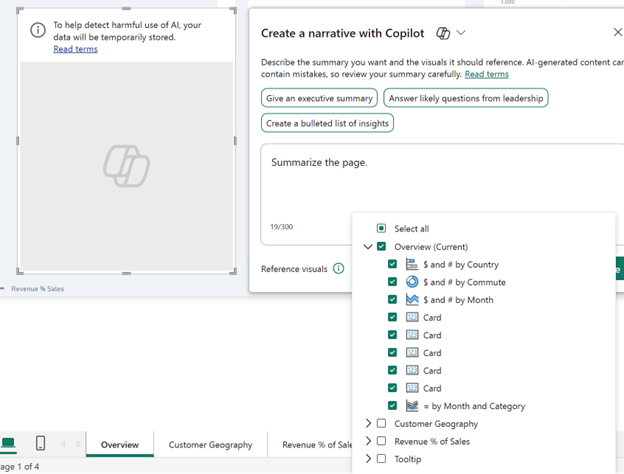
6. You can include or exclude individual visuals or pages, or summarize the entire report.
7. Read through the summary to make sure it's accurate.
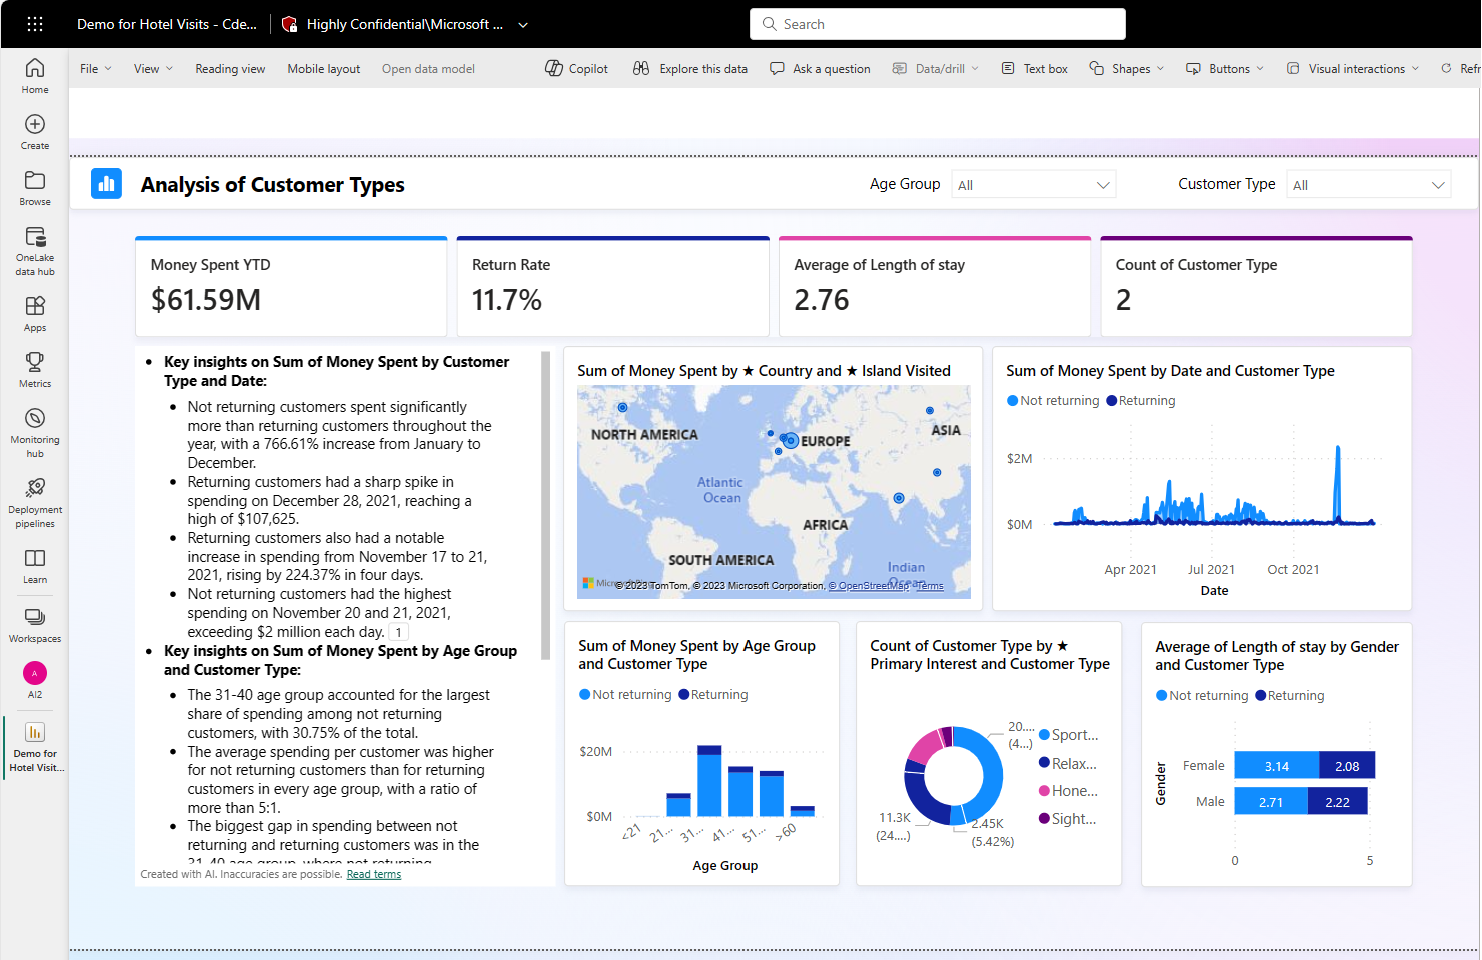
8. To change the narrative, in the Adjust your summary with Copilot, give instructions to change it, or use one of the suggested prompts.
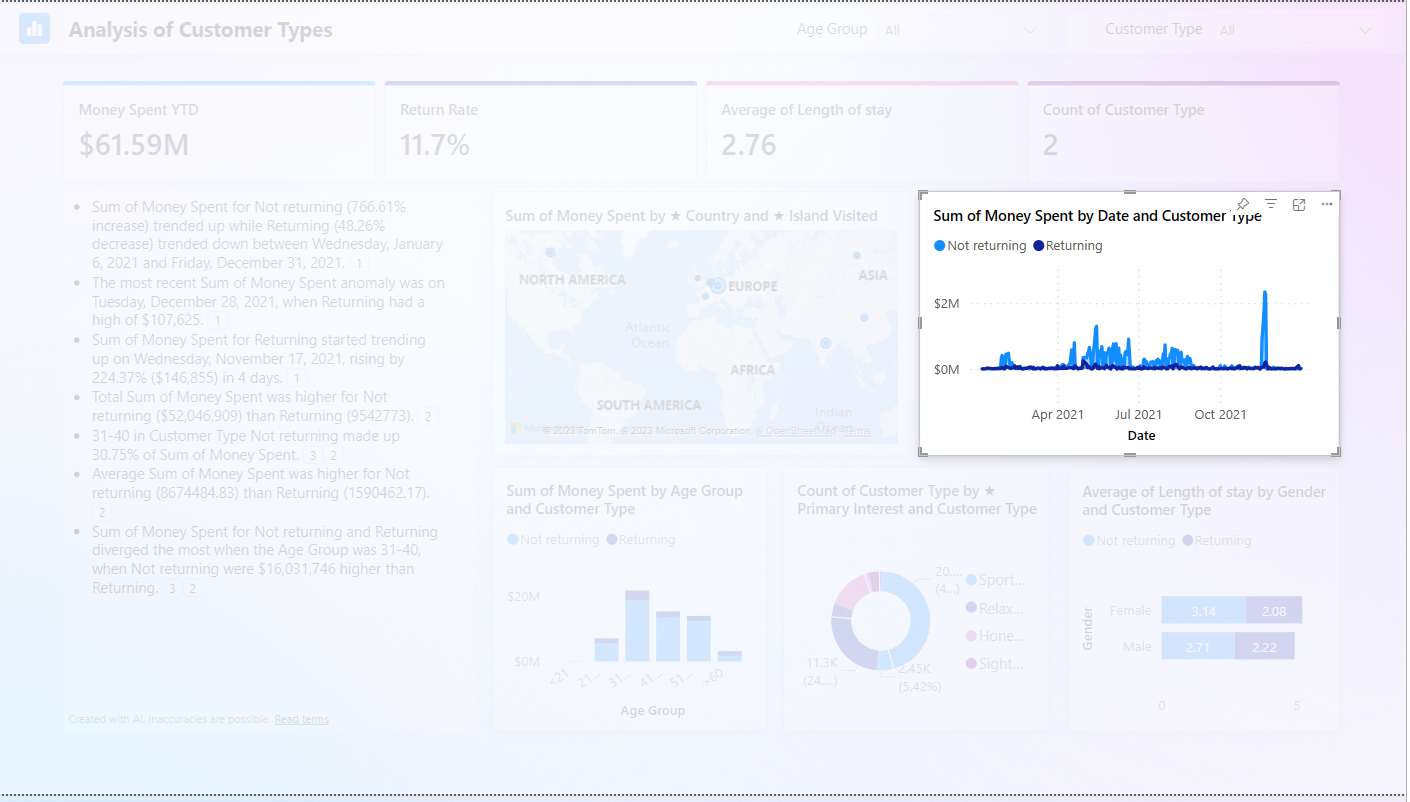
9. Select the footnotes to view references to specific visuals in the summary.
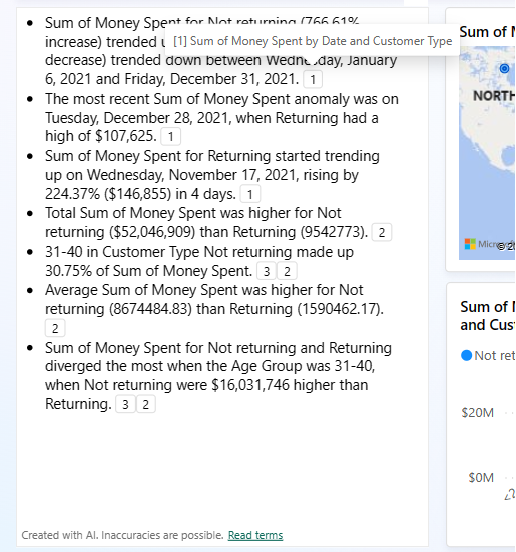
Power BI highlights the visual that the footnote refers to.
You can switch back and forth between the previous "smart narrative" visual and the new narrative visual with Copilot by selecting the icon next to the title. The summary content isn't lost when you switch back and forth. Switching may help, as you can't yet edit the body of the Copilot summary. For control over the generated summary, use custom prompts to specify tone or formatting, direct the summary to specific portions of the report, or clarify requests. You can copy and paste it into the smart narrative body for more involved editing.
When you're satisfied with the narrative, you save the report just like any other report. If you close and reopen the report that Copilot generated in the Power BI service, the report opens in Reading view and you don't see Copilot.
Source: learn.microsoft.com

12/11/2025


