- Training
- Service
- Promotion
- Schedule
- Testing Center
- News
- Contact


.png)
Over the years, people have created various games in Excel. It is simple to simulate rolling dice using -RANDBETWEEN(1,6) and now even simpler to shuffle a deck of cards using the amazing new SORTBY function. But back in 2006, Nobuya Chikada used Excel VBA to port the Pac-Man game to Excel 2003. The game still works today. Find it on Github: https://github.com/spences10/pacellman
.png)
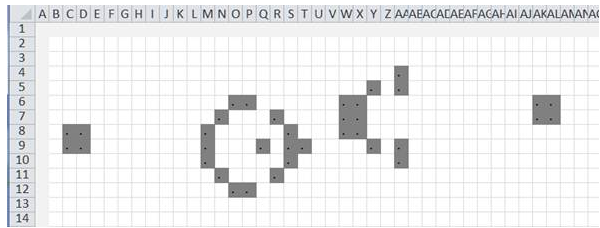
While using VBA unlocks great power, Excel applications built using VBA will never run on your mobile device or Excel Online. This awesome re-creation of Conway’s Game of Life by Tushar Mehta uses no VBA at all. Everything is handled using formulas and conditional formatting in Excel. Download the files and read more about it from http://dailydoseofexcel.com/archives/2011/04/06/conways-game-of-life-simulation-in-excel/
Art, Photos, and Animations in Excel
For a very funny stand-up routine about spreadsheets, watch this Matt Parker video:
In the video, Matt shows how you can meticulously convert a photo to an Excel spreadsheet using conditional formatting and a series of cells coded with RGB values between 0 and 255. Many people have automated the process of converting a photo to a spreadsheet. After watching Matt’s video for the science behind the trick, you can convert your own photo using tools such as https://towardsdatascience.com/converting-a-picture-into-an-excel-file-c735ab4e876d
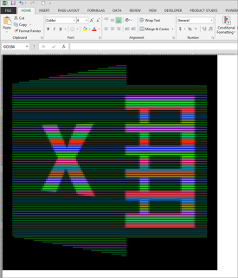
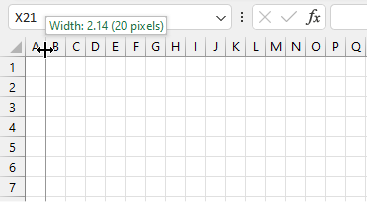
I’ve met many people who use Excel as a drawing canvas. Once you change the column width to have the same number of pixels as the row height, you have a very large sheet of graph paper.
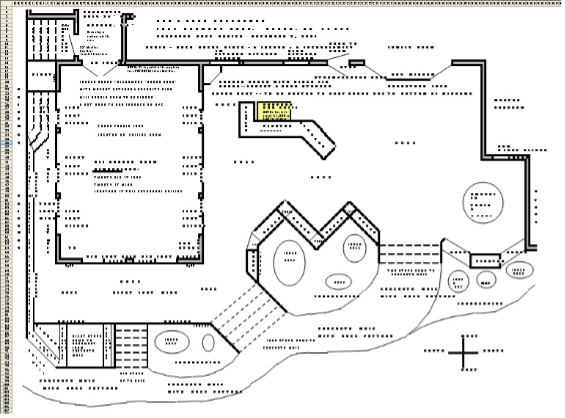
You can then use borders or fill color to make a rendering. Here is a complete landscape design that was done by using Excel as grid paper:
Other examples include people who use Excel for quilt design or for designing needlepoint or cross stitch as shown here: https://sewingmachinebuffs.com/how-to-make-a-cross-stitch-pattern-in-excel/
You’ve probably seen the artwork created in Excel by Tatsuo Horiuchi. He uses the drawing tools in Excel, along with fills and gradients to create very detailed artwork in Excel. See how he does it at:
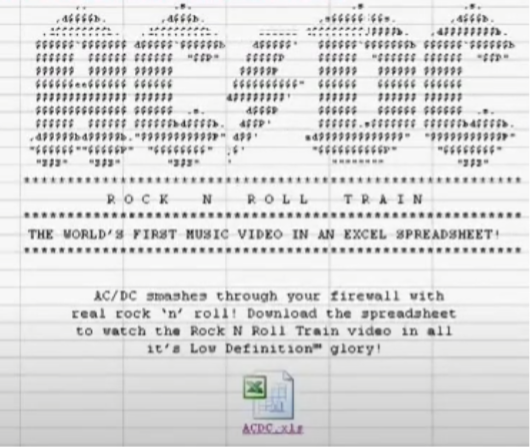
Back in 2008, someone associated with the band AC/DC made an amazing spreadsheet that rendered the music video for the song, Rock N Roll Train in Excel. You can watch the video here: Columbia Records - "AC/DC "Rock N Roll Train" - Excel music video" (adforum.com)
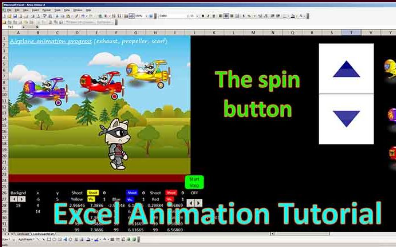
Another site with amazing animations in Excel is https://excelunusual.com/. There are over 150 animations and tutorials on the site, all based in Excel.
One very awesome and current use of Excel is the supporters of the Newcastle United Football Club of the English Premier League. The Wor Flags fan group is using a seat map in Excel of the 50K+ seats at their St. James’ Park stadium to plan out massive displays during the soccer match.
Here is a photo of a display from the final match of the 2021-2022 season. Note the white, black, and yellow “UNITED” on the far sidelines and the blue star on a white background in the Leazes’ End. Photo courtesy of Chris Heron of the Wor Flags group.
 Photo courtesy of Chris Heron and George Frizzlell of the Wor Flags group
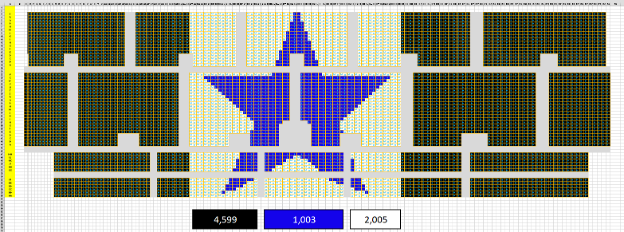
Planning of these stadium displays is all done in Excel. Wor Flags member Chris Heron explains how Excel is used. Consider the blue star at the end of the stadium. In a worksheet for this end of the stadium, 9,420 cells – from A1 to FA40 are used to show the seats and aisles. Since no one is sitting in the aisles, the art team has to be careful to not have letters span an aisle. Heron explains, “Essentially, each cell is like a pixel in the stadium.”
Compare the blue star in the image above with the Excel spreadsheet in the image below. Chris uses =(COUNTIF(B1:FA60,"B")*1.1) to count how many of each color of foil is needed for the display including 10% extra.
Heron notes that his day job is as a project manager for a Building Controls company. At work, he uses Excel “for just the usual things like work rotas, setting sheets, site reports & price lists.”
“I just thought we needed a system that could be used for designing these styles of displays and give those putting out foils/flags a map to show which colors go where. I thought of Excel because you can number each cell to show a location, and color each cell to establish designs. I left blank cells to show walkways and exits, as it gives a good idea if a letter will look good, or if it'll be broken up too much to be visible.”
Once everything is mapped out in Excel, the workbook is shared via a group of volunteers using WhatsApp. These volunteers then meticulously attach the colored foils to each seat in the stadium. The results are amazing.
Source: techcommunity.microsoft.com